It all started with a split personality
Split personality? Even though I use the computer for GIS and computer programming, what I really enjoy is drawing maps and cartoons with nib pen and ink, then coloring with Copic markers.
I’ve always had a creative side with a love of art and graphic design. But I’ve also always had a logical, technical side interested in computer programming and analysis.
That dicotomy of creativity and logic eventually led me into a Ph.D. in GeoSpatial Science, where I meld my logical side into spatial analysis and computer programming, and my creative side into cartography and map design.
So am I an artist or a nerd?
I’m both – a nerdy artist! I’d never survive trying to be one or the other. I need a foot in both worlds to be happy, because they are both creative outlets for me. And I’m driven to create.
Being a nerd for me doesn’t mean managing databases, maintaining equipment, or anything like that. Being a nerd for me means creative outlets like building websites, learning new programming languages, and developing interesting spatial analysis tools.
Yet, I also love creating beautiful things, such as designing maps, taking photographs, and designing websites.
But I also need meaning in my life. That is why I like helping others …
A family of educators
I grew up in a family with my dad being a teacher and a principal, my mom teaching first grade, my sister teaching English, and numerous aunts, uncles, and cousins all being teachers. I guess teaching runs in my blood. That’s why I give away so much free information. I believe in helping people achieve their highest level of abilities.
From my education classes (I was once a K–12 French Education major), I learned the importance of teaching to competency rather than for a grade. I want to help readers achieve new levels of competency.
I also learned the importance of careful, systematic teaching in small chunks to help people achieve mastery of topics.
But more than that, I teach to learn myself. It’s only by going in depth to teach something that my own understanding is further developed and that I achieve mastery.
How did I get involved in mapping?
My first exposure was while working on a second bachelor’s degree in Fisheries and Wildlife Science at Northeastern State University in Oklahoma. My advising professor saw my technical abilities and suggested I take a new GIS course being offered.
I enjoyed it, but didn’t think much about it after. That is, until after I moved to Denver, Colorado, and started working for an Environmental Consulting Firm. Although I started as a desktop publisher, I was again recognized for my technical abilities and soon my boss moved me into support of GIS.
 One of the major duties of the company involved drilling into soils to look for potential contamination before a client bought a property, saving possible lawsuits and costly remediation. When geologists brought back their field notes, I put the information into a specialty GIS and created bore hole logs and maps from the data for reports.
I also worked closely with environmental engineers to work on remediation projects.
What other areas have I worked in?
When I started Colorado State University planning to enter graduate school, GIS became an obvious choice. I applied, was accepted, and ended up with a Ph.D. in GeoSpatial Science.
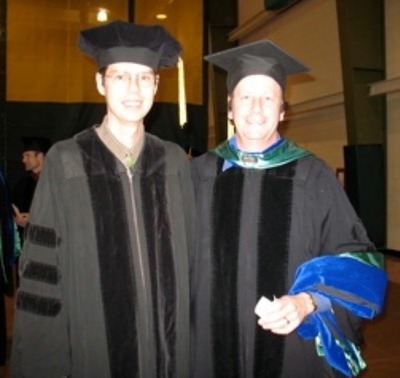
Graduation with my Ph.D. advisor, Dr. Denis Dean.
Most of my Master’s and Ph.D. research came from working in an environmental health laboratory with epidemiologists. Now I regularly work with veterenarians and disease ecologists.
I often look at my GeoSpatial programming and mapping skills a lot like statistics – it is a skill and knowledge that can apply to many different fields, and I enjoy working with scientists from different disciplines.
That’s a lot of technical stuff, how about the artistic side?
Although I get paid for my technical expertise, I also get a lot of recognition for “visual communication” – that’s making maps and graphs.
I’ve found that a lot of scientists are “what” people. That means they are good at analysis and explaining their analysis and results. But I’ve also found these same scientists often struggle with creating graphics that support their point. They frequently just want to show the data.
That’s where I come it. When they see a graph they made and want me to help them prepare a better graph for publication, I help them add a communication element that explains the graphic better. Using my knowledge of design, I can help them focus their message visually so that it supports what they want to say.
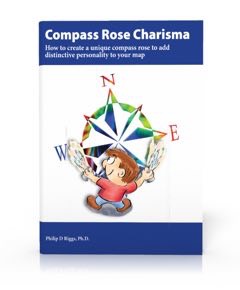
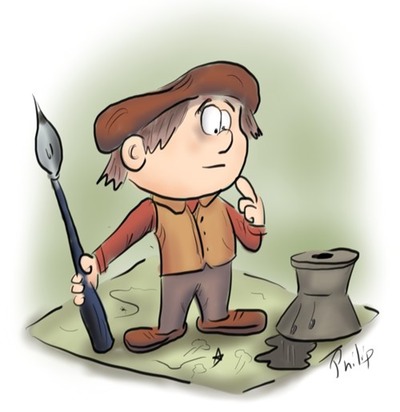
I draw cartoons for this site, and other places. But I enjoy drawing cartoons about life and things that happen to me, too.
In order to develop my design skills, I often read about and practice design. Sometimes I get a chance to develop my skills on projects, other times, because it is such a strong interest of mine, I’ll spend time in the evening or on weekends.
What else do I do in my spare time?
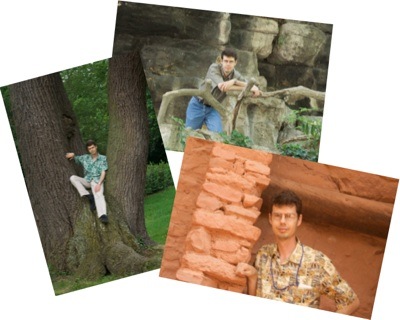
I’m a busy husband and father of four amazing kids. I enjoy photography, playing the accordion, and taking walks in nature areas.